
Getting started
Install Memtrace, boot the workspace runtime, connect your coding agent, sign in, and get your first real answer from your codebase — start to finish in one pass.
The official product is at memtrace.io, the npm package is memtrace, and the public repository is syncable-dev/memtrace-public. Other projects with the same name are unrelated. Compare memtrace --version with the Stable and Nightly release history.
The Syncable team maintains this package and its support channels. For installation help, open an issue in the official repository with your operating system, Memtrace version and exact error. Remove credentials and private source code from shared logs.
Memtrace is a local knowledge graph of your codebase that your coding agent queries over MCP instead of grepping. This page is the whole path: install, first run, connect an agent, sign in, and get a real answer back — in that order, with nothing skipped.
The five-minute path#
- 1Install the npm package
Memtrace ships as a single npm package,
memtrace, with prebuilt platform binaries. Install it globally.terminal$ npm install -g memtraceSTABLE VS NIGHTLYA plain
npm install -g memtracestays on stable. That is the default, and it still gets new features. For new features as they land, runnpm install -g memtrace@nightly. Samememtracecommand. It is not always stable. Switch back withnpm install -g memtrace@latest. Both commands are on the Nightly vs stable page.Postinstall does the safe local setup (when npm skips it, the
memtracecommand covers the same ground on first use): it selects the right platform package, prepares the bundled runtime, and (on Windows NVIDIA hosts) can fetch the CUDA execution provider. npm hides lifecycle output by default, so a normal install may only show npm's package summary. It does not touch your agent configuration yet — see the callout below.CONSENT GATEA plain
npm install -g memtracenever edits your agent config, skills, or hooks on its own, and it usually does not print the deferred setup plan because npm suppresses postinstall logs. Runmemtrace setupto review the planned changes interactively, runmemtrace setup --yesto apply them, or setMEMTRACE_INSTALL_YES=1before installing to pre-approve setup during install. Every consent-approved setup snapshots the files it's about to mutate first, somemtrace uninstallcan restore them byte-for-byte.NPM 12 BLOCKS INSTALL SCRIPTSnpm 12 and later skip a package's install scripts unless you allow them, so Memtrace completes setup on its first run instead. After an upgrade, the first
memtracecommand refreshes skills, MCP registrations, and the Claude Code plugin, and prints one line saying so. On a new install it shows the same change list and asks first (outside a terminal, or when a coding agent runs the command, it prints how to runmemtrace setup --yesand leaves your agent config alone). To run it during the install instead, allow the script:npm i -g memtrace --allow-scripts=memtrace. SetMEMTRACE_NO_AUTO_SETUP=1to turn off only the first-run step (memtrace setupandmemtrace updatestill set up your agents).npm install package summary - 2First run: memtrace start
From your repository root, boot the runtime.
terminal$ cd <your-repo> $ memtrace start
On a clean machine this single command signs you in, boots the local database, opens the dashboard, and starts indexing — see the boot order below for exactly what happens and when. The first embed download can take a while; the terminal prints an explicit "downloading embedding model" notice so the quiet stretch doesn't look like a hang. On RAM-constrained or CI hosts you can skip local ONNX entirely — point at OpenAI, Voyage, or a self-hosted Ollama server with remote embedding.
memtrace start boot sequence - 3Connect your coding agent
memtrace starthints at this automatically if it can't find an MCP config for your workspace. To wire up an agent explicitly, run one of the following — not both:terminal$ memtrace setup --yesThis registers Memtrace globally, with nine agent clients — Claude Code, Cursor, Codex, Gemini CLI, Windsurf, VS Code, Hermes, OpenCode, and Kiro — all with the same shape:
command: memtrace, args: ["mcp"], no environment variables required. Interactive terminals show an agent picker; pass--only <agent>to target one client instead of all nine.If you'd rather scope config to just the current project instead of your home directory, use the bundled installer's
--localflag directly:terminal$ npx -y memtrace-skills@latest install --localIf
memtrace startalready owns your workspace, an agent launchingmemtrace mcpattaches to that running owner instead of starting a second daemon — it prints "attaching to existing workspace owner pid N" and shares the same local database.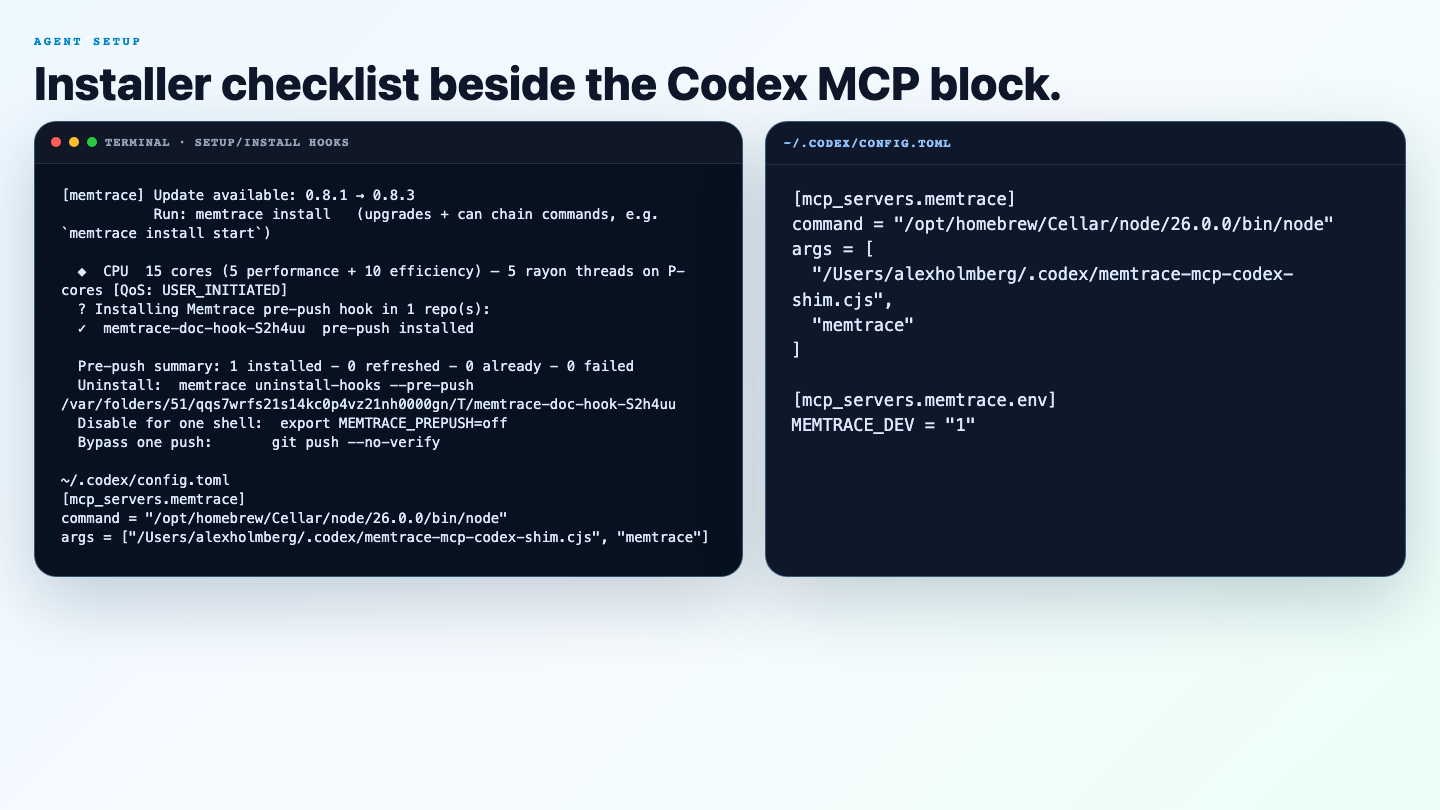
Installer output + Codex config - 4Sign in
The first
memtrace startruns a browser device-flow sign-in inline, automatically — you don't need to run this yourself unless you're setting up a second machine or a headless box.terminal$ memtrace auth login $ memtrace auth logout
The CLI prints an always-visible Claim URL and opens your browser; a waiting-room screen keeps that URL in its own block the whole time (press
oto reopen it). On a headless shell with no display, it falls back to plain polling with a copy-paste URL. Once claimed, your license key is exchanged for a session and saved to~/.config/memtrace/credentials.json.An account is required — Memtrace refuses to run fully anonymous — but once you're licensed, network blips don't lock you out: a transient failure to reach memtrace.io boots the server in degraded mode, still serving every tool, and re-validates in the background every five minutes. Only a definitive revoked/invalid/suspended response stops it. The same license key works on every machine you use — billing is by query credit, not by seat.
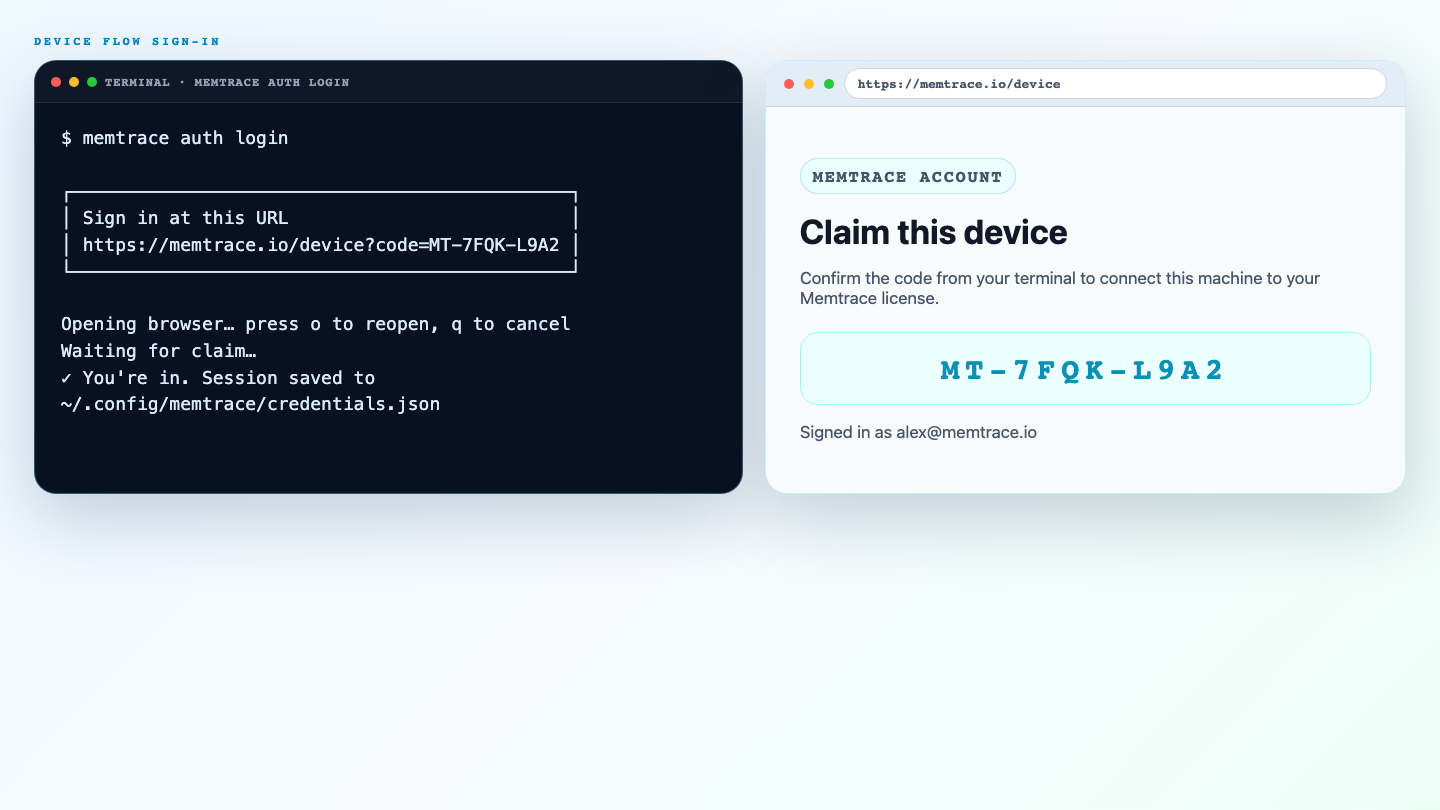
Device-flow sign-in - 5Get first value
Indexing is automatic —
memtrace startruns a two-phase bootstrap for every repo it finds (structural index first, embeddings and history second) — but you can also drive it directly, and check in on it:terminal$ memtrace index . $ memtrace status $ memtrace insight-card
After the first successful index of a repo, a Codebase Insight Card prints in the terminal: a curated three-line summary built from Memtrace's own graph algorithms — the hottest central symbol (with its caller count and when it was last edited), likely dead code, and a critical bridge symbol. (If the graph doesn't have enough data for those three, it falls back to a "modules detected" line instead.) Re-render it any time with
memtrace insight-card. From here the file watcher keeps the graph live on every save, and your agent can ask for a same-day summary through the daily briefing tool.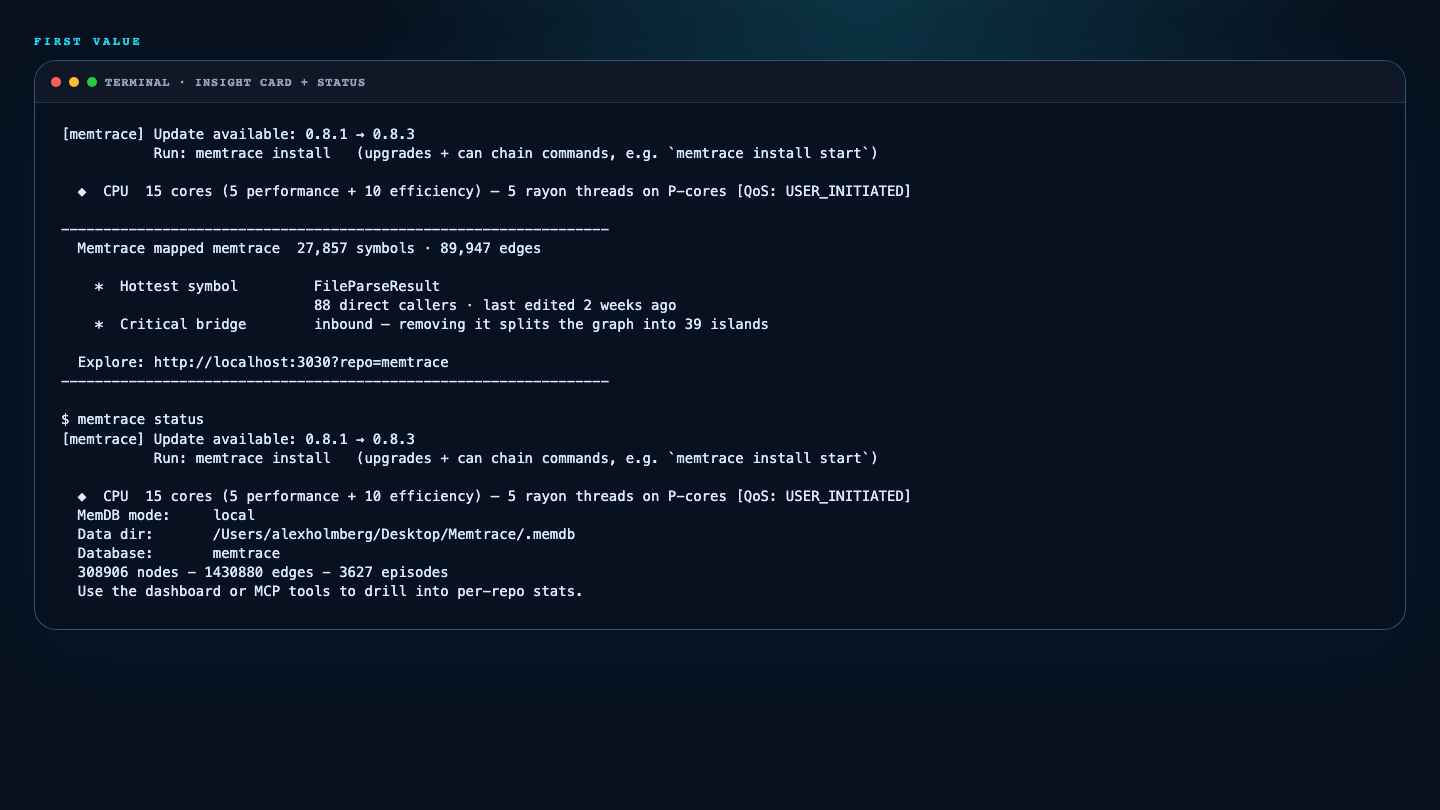
Insight card + status
What start actually boots#
memtrace start does a lot in one command. Here's the condensed order, gate by gate — useful when something looks stuck and you want to know which stage it's in.
A few things worth knowing about this order: the browser only auto-opens on a fresh boot — if a healthy daemon already owns the workspace, memtrace start just prints the existing URL and returns, no second daemon and no new tab (--force replaces the owner). Cortex decision memory is universal on every plan now, so its sidecars bootstrap in the background by default; any Cortex failure degrades with a warning and never blocks the rest of the stack. And if you run memtrace start from a folder containing several sibling repos, sharing one index across them is confirmation-gated — you'll get an interactive prompt (or set MEMTRACE_BLESS_WORKSPACE=1) before anything is combined.
Where to go next#
Nightly is for new features as they land. Same memtrace command. It is not always stable.
Supported languagesEvery programming language, infrastructure format, and authored-text type Memtrace indexes.
Supported clientsSee exactly what config each of the nine supported agents gets, and where it's written.
RequirementsPlatforms, ports, and disk footprint — what you need before you install.
memtrace start referenceEvery flag and env var for the command that boots the runtime.
ArchitectureHow the daemon, MemDB, Cortex sidecars, and your agent fit together.