
Code quality & review
Graph-reachability dead code, exact copy-paste detection, cyclomatic/cognitive complexity, hotspots, and a local deterministic review engine that can review and post to GitHub pull requests.
Memtrace's quality tools read the same indexed graph as everything else — dead code, complexity, and hotspots come from graph reachability and bi-temporal version history, not text heuristics. The review engine layers AST detectors, a YAML rule pack, and optional cross-module graph checks on top, all running locally with no LLM and no network call — the same engine can review a local diff or a live GitHub pull request.
Overview#
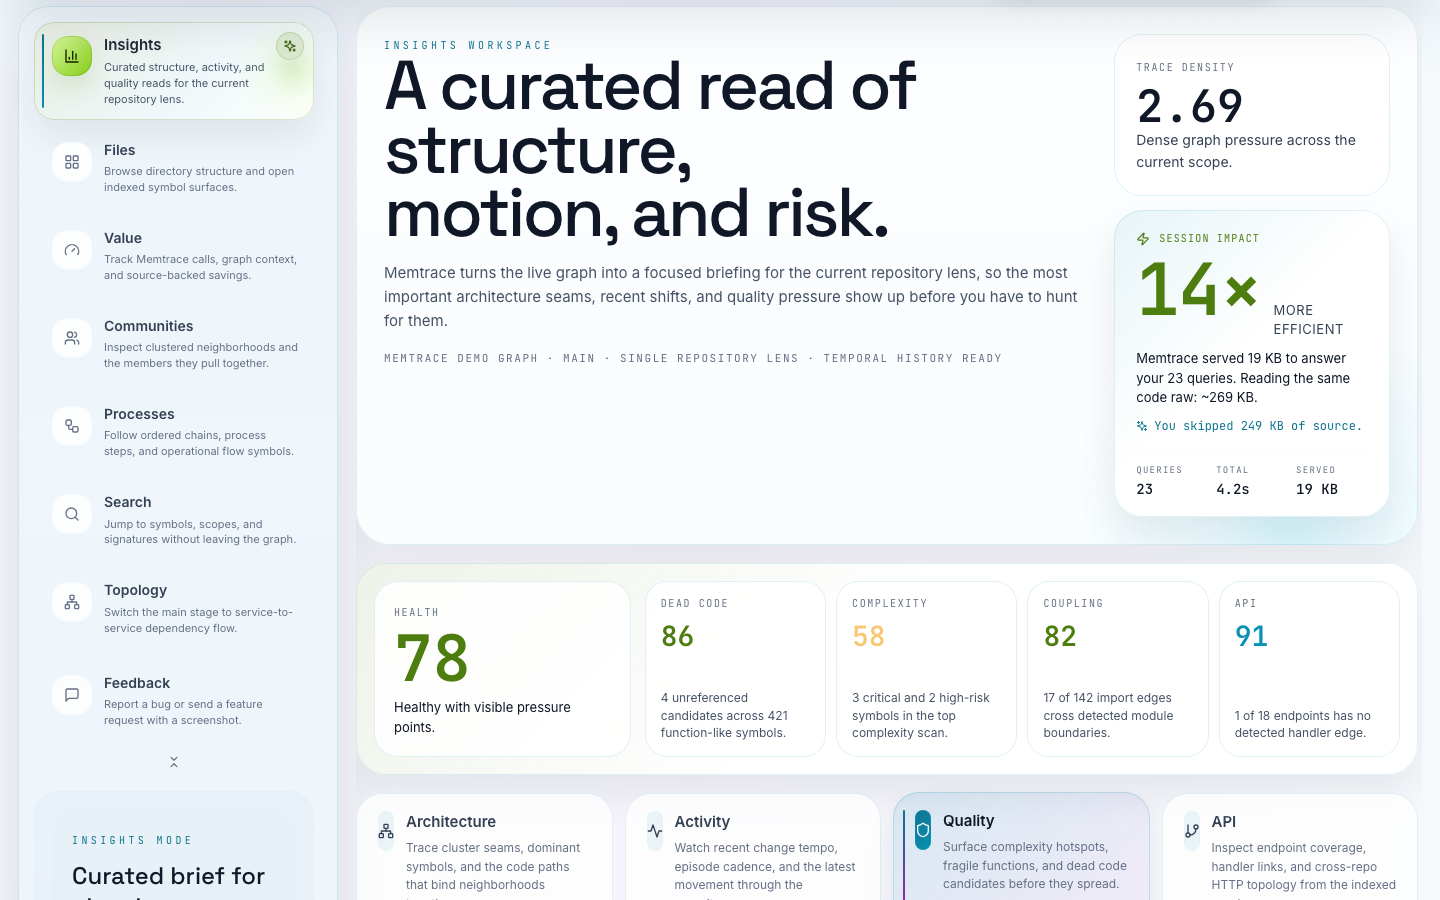
The Insights page's Quality tab is the visual face of this same analytics — complexity hotspots, fragile functions, and dead-code candidates in one editorial view.
Dead code via graph reachability#
find_dead_code finds functions and methods with zero callers in the graph — dead-code candidates found by reachability, not by grepping for the symbol name. It excludes exported symbols, process entry points, and test files by default (pass include_tests: true to include them too). Use it during cleanup sprints or before a major refactor to find code that can be safely deleted without breaking anything.
Because reachability comes from the same graph get_impact uses, a symbol find_dead_code flags with zero callers is a much stronger signal than "no grep hits" — it accounts for every typed call edge Memtrace indexed, not just literal string matches.
Exact duplicates (copy-paste detection)#
find_duplicate_code finds functions and methods whose body is an exact copy of another symbol's. Two symbols pair as duplicates when all three match: the normalized body shape (formatting and layout differences don't break the match, but the logic must be identical — near-duplicates are not measured), the symbol kind, and the parameter count. Bodies below a minimum size — roughly six lines of real code — never pair, so shared ceremony like constructors, getters, and one-line wrappers doesn't register as copy-paste.
Within each clone group the earliest declaration (by file, then line) is treated as the original, and every other site is reported as a copy citing it — stable across runs, so the same symbol isn't the "original" one day and the "copy" the next. A declaration the graph holds more than once (for example under a branch snapshot and a working-tree overlay of the same file) counts as one site: it can't be reported as a duplicate of itself, and a genuine two-file pair yields one finding, not one per stored copy.
Unlike find_dead_code, this finding is about the body, not the callers: an exported or routed symbol is reported the same as any other, and reachability plays no part. The action is to extract a shared implementation. For symbols nothing calls, use find_dead_code instead — the two tools report on separate surfaces and never mix their findings.
Parameters: repo_id (required), branch, include_tests (default false — test files and test symbols are excluded), limit (default 20, capped at 200), include_historical and as_of_micros (default: current code only). Findings carry confidence: "medium" deliberately — an identical normalized body above the size floor is strong evidence of copy-paste, but it remains a shape match, and two independent implementations of the same small algorithm can converge.
When branch is omitted, the scan scopes to the repository's current branch — the same scoping find_dead_code and find_hotspots use. An explicitly requested branch that matches no indexed function records (in a repository that has them) is an error, never a silent unscoped scan: the error is what distinguishes "you named a branch the index doesn't hold" from "this branch is clean". Pass the branch that was indexed, or omit branch.
The same scan feeds the dashboard: the Insights health widget's "Exact duplication" figure counts duplicated function bodies — the copies beyond the first original in each clone group — across the production population (tests excluded, current code only). Zero reads as clear, anything above zero as worth review, and a failed scan reports itself as unavailable rather than pretending the count is zero. See the dashboard.
Complexity metrics#
calculate_cyclomatic_complexity approximates a specific function's cyclomatic complexity from its call-graph out-degree — how many distinct paths it calls — and returns a risk level. find_most_complex_functions ranks the top-N most complex functions or methods in a repository the same way, for spotting technical-debt hotspots at a glance. get_function_quality_metrics returns the full picture for one named function: cyclomatic complexity, cognitive complexity, parameter count, fanout, direct callers, outgoing calls, risk level, file location, and scope path — the exact numbers to check before editing a refactor target the graph or the Insights UI already flagged.
| Risk level | Cyclomatic complexity |
|---|---|
| low | ≤ 10 |
| medium | 11–20 |
| high | 21–50 |
| critical | > 50 |
Those bands are calculate_cyclomatic_complexity's. get_function_quality_metrics and find_most_complex_functions compute risk level differently — they also weigh direct caller count: critical at complexity > 50 or callers > 40, high at complexity > 20 or callers > 15, medium at complexity > 10 or callers > 5, low otherwise. The two scales can disagree on the same function, so check which tool produced a given risk level before acting on it.
Cognitive complexity (surfaced via get_function_quality_metrics) follows the SonarSource definition — it penalizes nesting and control-flow breaks more heavily than raw branch count, so it tracks how hard a function is to read, not just how many paths it has.
Hotspots & cross-module issues#
find_hotspots ranks functions by complexity × recent churn, computed from the bi-temporal version history — a complex function under active churn is where the next bug lives. Hotspots beat raw complexity ranking for prioritizing refactors because they weight risk by how often the code is actually touched; a hairball nobody has changed in a year is lower priority than a moderately complex function that gets edited weekly. The look-back window defaults to 14 days, and results are capped at 20 by default.
find_cross_module_issues flags boundary-crossing problems a single-file AST scan can't see — a diff that changes a function signature, and another file's call sites don't match the new shape; a renamed function whose old call sites weren't updated; a deleted symbol still referenced elsewhere; a new interface method that isn't implemented everywhere. This is a diff-scoped detector used inside the review engine (below), backed by the same graph.
AST + YAML review rules#
Three MCP tools run Memtrace's local, deterministic review detectors against a unified diff:
find_ast_review_issues— hard-coded AST detectors for high-conviction bug patterns: abstract methods left unimplemented, docstrings that drift from a changed return type, a copy that gets mutated while the original is returned, and database queries issued inside a loop.find_yaml_rule_matches— runs the bundled multi-language YAML rule pack (ast-grep / tree-sitter under the hood) or a caller-supplied rules directory. Rule classes cover CSPRNG misuse in tokens, SQL string concatenation, disabled TLS verification, unsafe deserialization, ORM N+1 queries, sync I/O inside async code, and more, across Python, TypeScript/JavaScript, Go, Java, Ruby, C#, Rust, Swift, Kotlin, and Lua.find_code_review_issues— the product-level review surface: combines the AST detectors, the YAML rule pack, and cross-module graph checks (when arepo_idis supplied) under one shared confidence/ranking policy, deterministically — no LLM, no network, no benchmark-specific paths.
All three are pure structural analysis: they read the diff and, for graph-backed checks, the indexed repository — nothing is sent anywhere.
Custom YAML rules & test context#
Rule packs ship as <lang>/<rule-id>.yaml files under Memtrace's bundled rules directory, and find_yaml_rule_matches accepts a rules_dir override so a team can add its own rules in the same ast-grep-style format without forking Memtrace.
The prod|test|any context field
Every rule carries a context field — prod, test, or any — so the same pattern can be judged differently depending on where it shows up. A hard-coded sleep or a weak random seed is a real problem in production code but often intentional in a test fixture; a rule scoped to prod only fires outside test regions, one scoped to test only fires inside them, and any fires everywhere. The bundled rule pack itself is 315 YAML rules, each carrying a context field, and Memtrace judges test-vs-prod with its own per-language, ast-grep-based test-region detector — a real AST walk, not a file-path guess — so a production helper that happens to live under a test/ directory isn't misjudged.
Set a rule's context to prod for anything that should never fire inside test code — it cuts review noise on fixtures, mocks, and intentionally-relaxed test helpers without losing the check where it actually matters.
GitHub PR review#
The dedicated Code reviewer guide covers the full workflow, @memtrace commands, automatic fixes, and the offline benchmark where Memtrace ranks #1 (~20% ahead of Cubic v2 on 3-judge mean F1). This section summarizes the CLI surface.
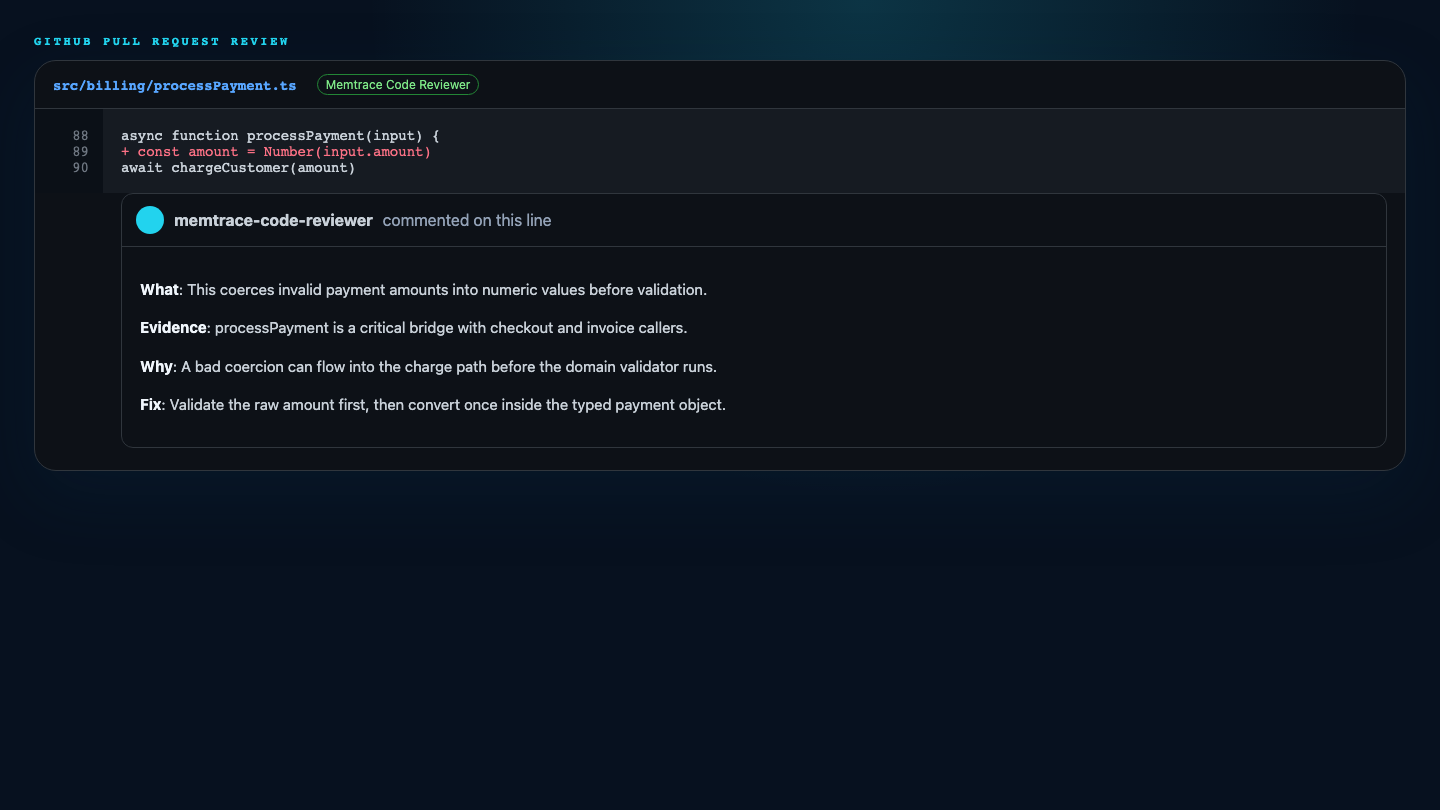
memtrace code-review --pr <URL> [--post] [--watch] reviews a GitHub pull request using local Memtrace context, and the same engine is exposed over MCP as review_github_pr. The privacy boundary is exact:
The hosted service only mints a short-lived GitHub App installation token; diff analysis, graph lookup, and review ranking all run on the local machine. Source code is never sent to Memtrace's SaaS — the hosted service is used purely as the GitHub App auth/token broker.
Concretely: --pr mode requires a prior memtrace auth login session (or MEMTRACE_LICENSE_KEY). Memtrace exchanges that session token for a GitHub App installation token by calling {MEMTRACE_AUTH_URL}/api/github/installation-token, then uses the installation token directly against api.github.com to fetch the PR's metadata and unified diff. No clone or fetch of the PR branch happens — the review reads the diff plus your local working tree, not a checkout of the PR head, and warns (without failing) if your local HEAD differs from the PR's head SHA.
$ memtrace code-review --pr https://github.com/acme/app/pull/123
# dry-run preview: prints findings, publishes nothing

$ memtrace code-review --pr https://github.com/acme/app/pull/123 --post --watch
# posts inline review comments to GitHub, then registers a local watch

$ memtrace code-review --diff changes.diff --repo-id app --json
# local unified diff, CI-friendly: never contacts GitHub or the token broker

$ git diff origin/main...HEAD | memtrace code-review --diff - --repo-id app
# pipe a working-tree diff via stdin
Local-input modes (--diff or --base/--head) never touch the token broker or GitHub at all — output is forced to JSON and dry-run, which is exactly what makes them safe to drop into a CI pipeline. --post and --watch only apply to --pr mode; passing them alongside --diff or --base/--head is a hard error.
PR status & sync#
--watch (only valid alongside --post) registers a local PR watch after a successful post, so Memtrace can track the human response over time. memtrace pr status lists every watched PR with its current state — awaiting_response, human_replied, approved, changes_requested, merged, closed, stale_after_push, or poll_error — plus posted-comment and @memtrace-command counts. It's purely local and read-only: a missing or malformed watch file just reads as no watches registered.
memtrace pr sync polls GitHub once, refreshes every watch's status through the same installation-token broker, and by default also executes any queued @memtrace commands found in PR comments (review, rerun, explain, ignore, fix this, merge) — pass --no-execute to only record commands as pending without running them. In practice you rarely run sync by hand: any running memtrace start or memtrace mcp process already polls in the background on the same schedule.
$ memtrace pr
# same as: memtrace pr status

$ memtrace pr sync
# poll once, refresh statuses, execute queued @memtrace commands

$ memtrace pr sync --no-execute
# refresh statuses only — record commands as pending, don't run them
By default, pr sync executes queued @memtrace commands, which can post comments, reactions, and check runs, push commits, or merge the PR. Command execution is permission-gated through GitHub's collaborator-permission API — ignore/fix this/merge require write access; review/rerun/explain only need the PR author or a read-level collaborator.
Related pages: Code reviewer, architecture & graph intelligence for the blast-radius tools cross-module detectors use, and the code-review CLI reference for the full flag surface.