
How Memtrace runs
One binary, three moving parts: the MemDB storage sidecar, the workspace runtime on :3030, and Cortex decision memory — plus how MCP clients attach and proxy Cortex calls without duplicating the stack.
Everything ships in a single memtrace binary, but a running workspace is made of a few cooperating processes. Understanding the shape of them explains why a second agent connecting doesn't spawn a second daemon, why the dashboard and the MCP tools see the same graph, and what each process depends on.
One binary, several processes#
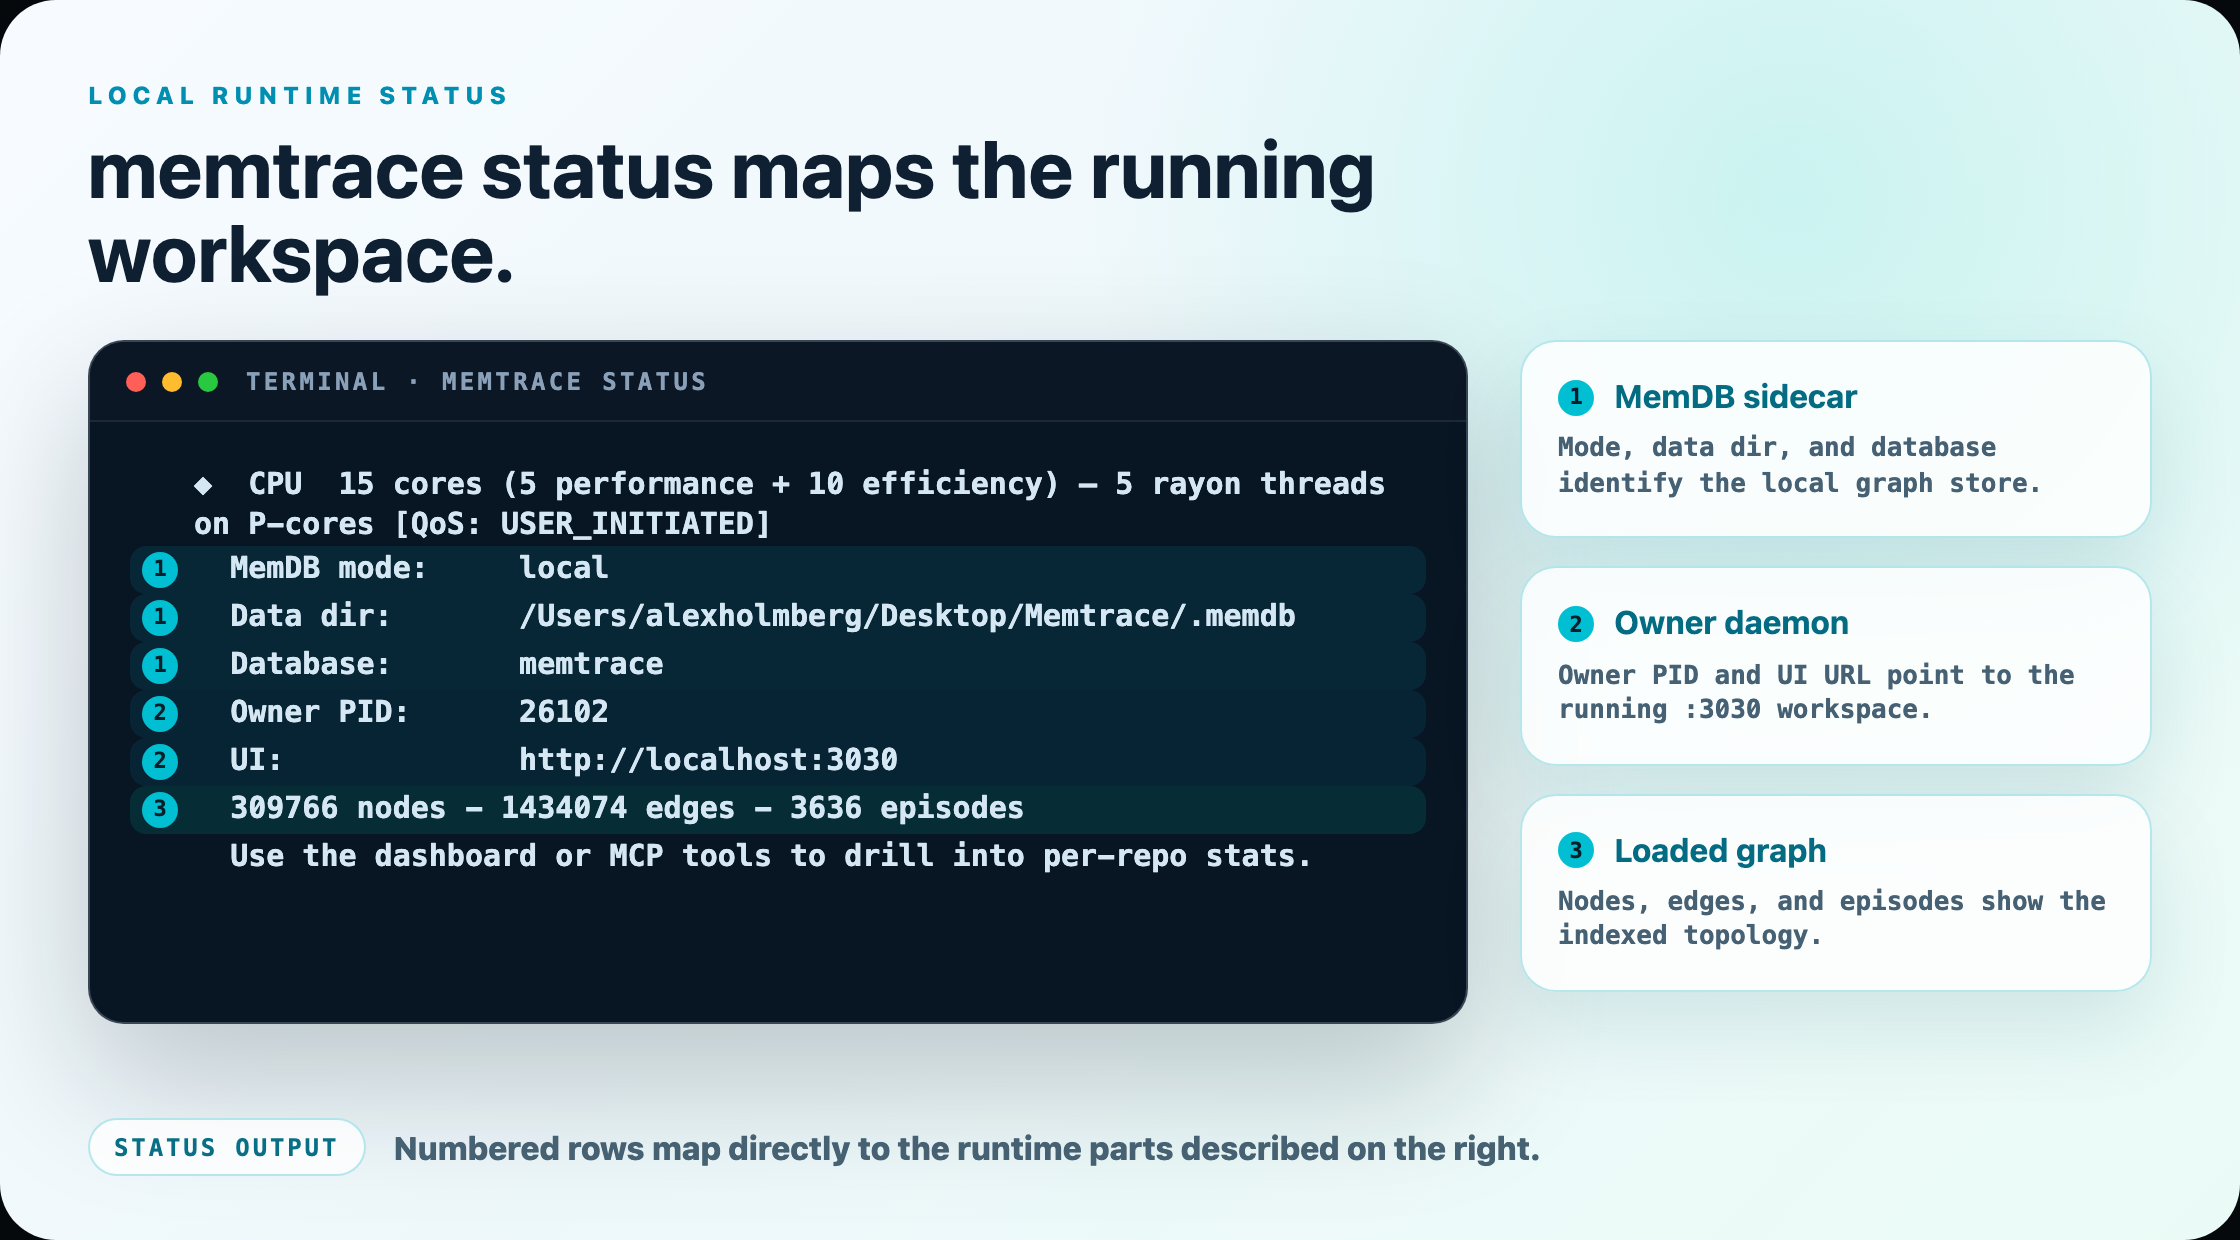
memtrace start is the usual long-lived workspace owner. If no owner is running, the first memtrace mcp client can take the same lease and own the workspace for its session. Either owner boots a local MemDB storage engine — by default as a separate memcore-server sidecar process, reached over a loopback gRPC connection on 127.0.0.1:50051 — then serves a REST/WebSocket API and the dashboard UI on 127.0.0.1:3030, bound to loopback only unless you explicitly set MEMTRACE_UI_HOST to expose it. That same :3030 server is also where MCP-over-HTTP lives when a client asks for it.
The workspace owner also spawns one Cortex sidecar in the background: memcortex-daemon, which owns capture, ingest, and the local query endpoint. It is fail-safe — if the sidecar binary is missing or the bootstrap doesn't succeed, Cortex simply doesn't answer; it never blocks or crashes the core runtime.
memtrace mcp registers recall_decision, get_arc, verify_intent, why_is_this_here, and governing_contracts, then forwards those calls to the local Cortex endpoint. The installer intentionally writes no separate client entry for memcortex-mcp. That legacy development adapter is fail-closed unless explicitly opted in; configure only memtrace mcp. See Cortex for the supported status and recovery flow.
Process topology#
One process owns a workspace at a time: normally memtrace start, otherwise the first standalone memtrace mcp client. The MemDB and Cortex sidecars sit behind that lease; MCP clients and the browser dashboard are the two ways in.
The Cortex sidecar is fail-safe by construction: every Cortex bootstrap step is gated and degrades with a warning rather than blocking the rest of memtrace start. If memcortex-daemon never comes up, the workspace runtime, the dashboard, and the other MCP tools all keep working normally. The five Cortex tool schemas remain visible and return an explicit unavailable result.
How memtrace mcp owns or attaches#
memtrace mcp is what your IDE or agent actually launches — it's the process every configured client (Claude Code, Cursor, Codex, and the rest) spawns over stdio. It is headless by default (no UI port bound unless you pass --ui or set MEMTRACE_MCP_UI=1). In default local mode it first looks for an already-running workspace owner and attaches to it: same MemDB, same data directories, one shared graph. If none is compatible and reachable, it takes the owner lease and starts the local MemDB and Cortex sidecars before serving MCP.
Concretely, it reads ~/.memtrace/runtime.json to find a workspace owner whose git root matches the current repo and whose process is still alive, then confirms that owner's daemon-state.json answers on its loopback endpoint within 300ms. If it does, the MCP process prints attaching to existing workspace owner pid <N> and proxies straight to that MemDB instance rather than spawning a second memcore-server and a second index of the same repo. Otherwise application-state initialization establishes the owner and its sidecars; MCP never probes a not-yet-started local endpoint before that initialization gets a chance to run.
If no owner is found — or if you set MEMTRACE_OWNER_ATTACH=0 to disable this entirely — memtrace mcp falls back to its own env-derived config and, in local mode, pings MEMTRACE_MEMDB_ENDPOINT (default http://127.0.0.1:50051) directly; if nothing answers there it exits rather than silently starting a fresh, disconnected stack. Attachment is repo-scoped: an MCP session opened in a different repository won't adopt a daemon owning some other workspace.
Run memtrace start once per workspace, then point as many MCP clients at it as you like — each new memtrace mcp invocation attaches to the same owner instead of duplicating the index. See memtrace mcp for the full flag and environment-variable reference.
Data locations#
Each workspace keeps its MemDB data in a .memdb directory at the git root (or cwd) by default. Memtrace's own cross-workspace state — the embedding model cache, persisted watch registrations, the runtime owner file — lives under ~/.memtrace. Cortex decisions live separately in the machine-global ~/.memtrace/cortex-store; code-graph reset and reindex commands do not rebuild or clear that store. Use the separate memtrace cortex debug/reset workflow when decision memory needs diagnosis or safe runtime recovery. The Cortex reset preserves the durable graph and governance lifecycle; it is not a full reindex. See data directories for the full layout and the environment variables that override each path.
Next: see how the graph itself is structured in the temporal knowledge graph, or how multiple repos share a workspace in workspaces.