
Code search & context
Hybrid BM25 + semantic search over your indexed graph, plus token-lean source windows and a repo style fingerprint.
Every agent search starts the same way: a query goes in, and Memtrace has to decide what actually matches. find_code fuses full-text and semantic search over the whole indexed graph, then every other tool on this page builds on top of that result — expanding it into graph context, reading it back with token-aware compression, or extracting the repo's own coding conventions.
Overview#
Search in Memtrace isn't a single index — it's a small pipeline. A query is scored two ways at once, the two rankings are fused into one list, and from there an agent typically asks the graph what a result actually means before reading any source.
find_code & find_symbol#
find_code is hybrid BM25 full-text plus semantic (vector) search, fused with Reciprocal Rank Fusion. It works for natural-language queries — "authentication token validation", "retry logic for HTTP calls" — and for exact symbol names alike. Omit repo_id to search across every indexed repository at once. Results carry file_path, start_line, kind, and a relevance score.
find_symbol is the faster, narrower sibling: an exact name lookup rather than a ranked search. It accepts fuzzy and edit_distance params for forward API compatibility, but they don't yet perform fuzzy/Levenshtein matching — MemDB has no fuzzy RPC, so lookups are exact-match regardless of what you pass. It also returns a precomputed blast-radius envelope — complexity score, direct callers, risk level — on every hit, so an agent doesn't need a second round-trip before deciding how carefully to proceed.
| Tool | Best for | Notable params |
|---|---|---|
find_code | Natural-language or symbol queries, ranked results | query, repo_id (omit for all repos), as_of (time-travel), worktree / include_overlays |
find_symbol | Exact name lookup with blast radius attached | name, fuzzy (reserved, not yet active), edit_distance (reserved, not yet active), kind |
Both tools support time-travel with as_of (an ISO-8601 timestamp), so you can search the codebase as it existed at a past commit — useful when investigating a regression or reviewing what a symbol looked like before a change.
Search results tell you where code is. The recommended next step is a graph tool — get_symbol_context, analyze_relationships, or get_impact — to learn why a result matters before reading or editing it. Only read the full code once you're ready to quote or change it.
get_symbol_context#
get_symbol_context is the 360-degree view of one symbol: direct callers, callees, type references, which community (logical module) it belongs to, which execution processes it participates in, and cross-repo API callers — all in a single call. It's the tool to reach for immediately before modifying a symbol, since it answers "what touches this, and what does this touch?" without the multiple round-trips analyze_relationships would otherwise take.
analyze_relationships is the lower-level traversal underneath — find_callers, find_callees, class_hierarchy, overrides, imports, exporters, and type_usages query types — for when you need one specific edge type rather than the full neighborhood.
Compressed source windows (lean-ctx)#
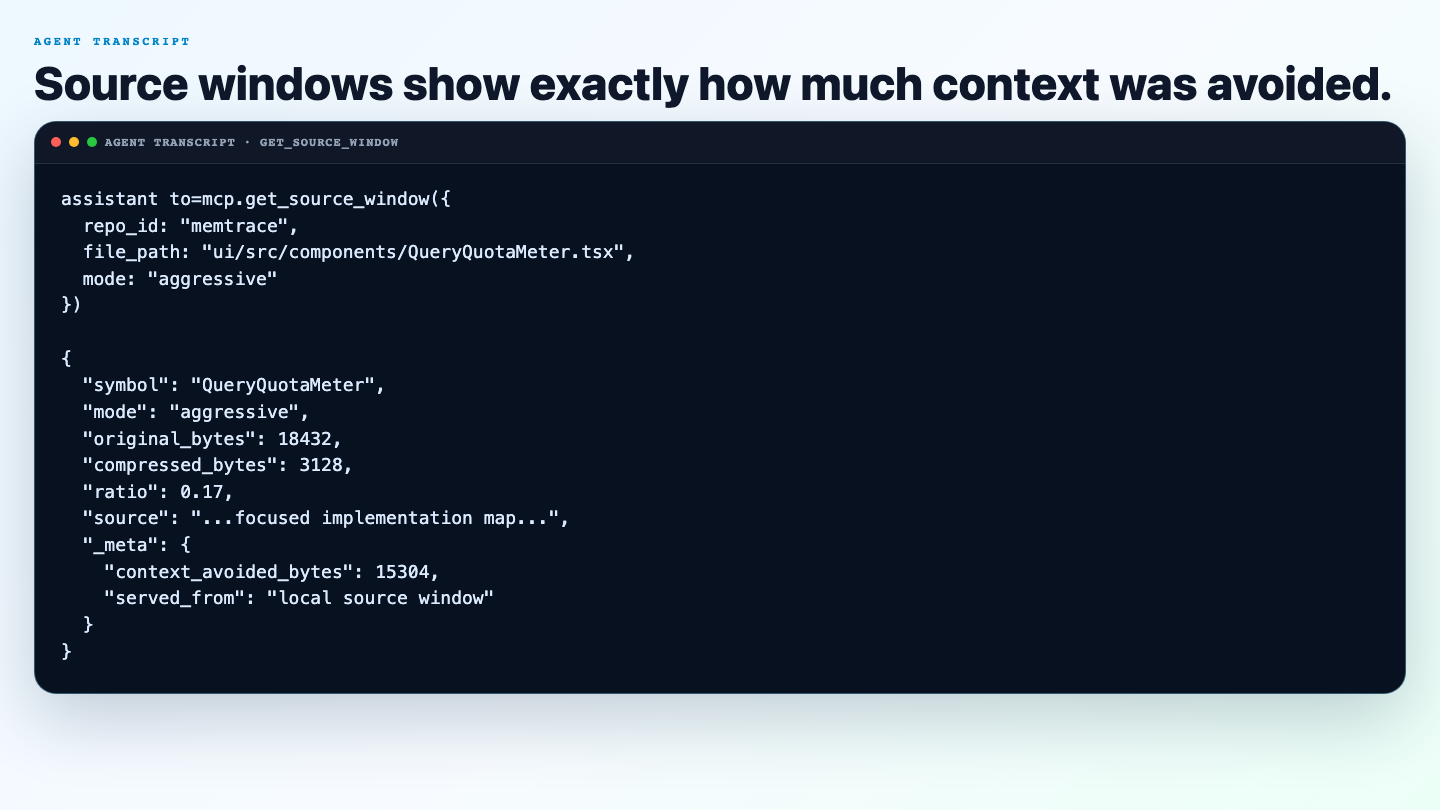
get_source_window reads a bounded, numbered slice of source once a search or graph tool has already told you the precise file_path + start_line. It defaults to 8 lines of context before the target and 24 after, capped at 120 returned lines (hard ceiling 400) — enough to read a function in situ without pulling the whole file into context.
What makes it worth reaching for over a plain file read is the mode parameter, backed by vendored lean-ctx compression primitives:
| Mode | What it does | Typical reduction |
|---|---|---|
raw | Verbatim passthrough — no compression | none |
lightweight | Default. Whitespace and blank-line cleanup | ~10–30% |
aggressive | Comment and boilerplate stripping | ~70–95% (language-dependent) |
map | Function-signature-only file map — bodies elided, signatures and doc comments kept | ~95–99% |
The default mode is lightweight, not raw — Memtrace assumes you want the token savings unless you explicitly ask for verbatim source with mode: "raw". Every non-raw response reports original_bytes, compressed_bytes, and ratio, plus a top-level _meta.context_avoided_bytes envelope, so an agent (or you, reading the transcript) can see exactly how many bytes of context a call avoided pulling in.
lean-ctx is vendored directly into Memtrace (Apache-2.0) and is always on — it isn't an optional add-on dependency you need to configure.
Style fingerprint#
get_style_fingerprint computes an empirical style fingerprint for an indexed repo: histograms of competing AST idioms — ternary vs. if-else, arrow functions vs. function declarations, const vs. let, await vs. .then, early return vs. nested return — plus computed ratios and the top-3 dominant idioms. Pass a file_path to also get that file's fingerprint and its delta from the codebase-wide norm.
It's descriptive, not prescriptive: the tool reports what the codebase actually does, not what it should do. Use it before writing new code in an unfamiliar repo — "should I use a ternary or an if statement here?" — so generated code matches the house style instead of introducing a visibly foreign pattern. Ratios come back null when a dimension has fewer than 20 observations — that means the codebase hasn't produced enough signal to commit to a norm there, not that the tool failed.
For prescriptive rules instead of descriptive ones — security patterns, banned constructs, required conventions — see code quality & review's find_code_review_issues.
Quota-billable status#
find_code, find_symbol, get_source_window, get_symbol_context, and get_style_fingerprint are all metered graph-query tools — each call counts against your plan's monthly query allowance (and Community's daily throttle once the monthly limit is hit). Purely structural lookups like list_indexed_repositories, get_repository_stats, and get_directory_tree are not billed, since they don't query the graph's content.
memtrace status reports MemDB mode/backend, graph totals, daemon/owner state, and auth session health — it doesn't include plan or quota usage. For remaining query allowance, check the daemon's quota meter in the dashboard UI (backed by GET /api/quota).
See plans for the exact monthly/daily numbers per plan.